How did Zimbabwe’s economy get so bad?
On the 18 April 1980 Zimbabwe gained independence. At that time the country had a strong infrastructure of railways, roads, airports, electricity generation, an efficient civil service with a functioning legal system and strong industry, commerce and agricultural sectors and was often referred to as ‘Africa’s breadbasket.’ The future looked bright, so how did it get to the situation where in 2025 42% of its population faces food insecurity?[1]
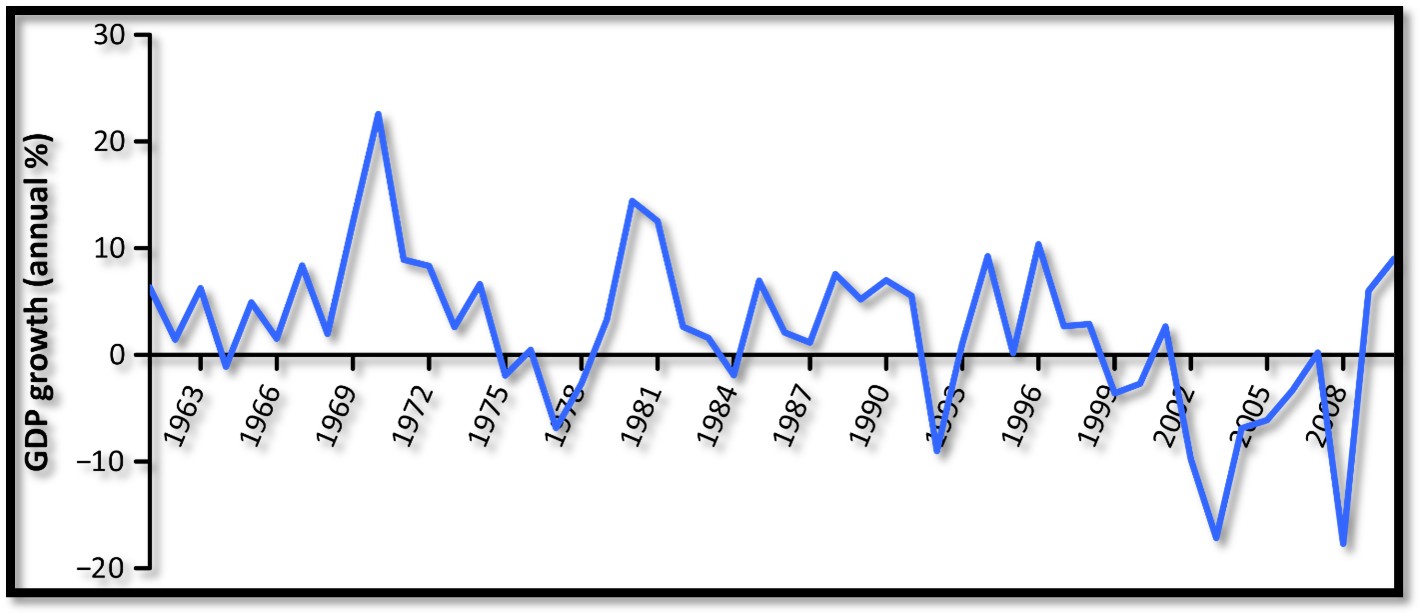
Zimbabwe’s annual growth rate 1961 to 2010
1960 to 1980
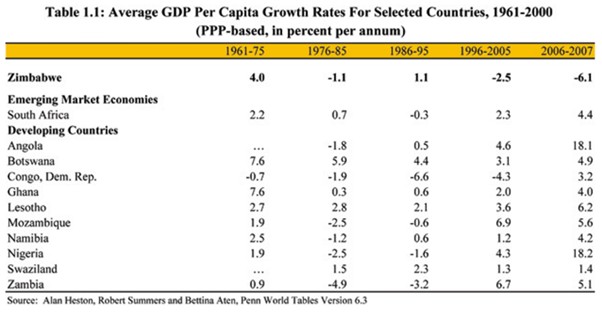
In the years 1960 – 80 leading up to independence real GDP growth rates in Rhodesia averaged nearly 4.5% reflecting government policies that encouraged investment in domestic manufacturing and agriculture.[2] There was a requirement to circumvent international sanctions following the declaration of Unilateral Declaration of Independence (UDI) from Britain on 11 November 1965.
During the decade 1960 – 70 manufacture was the driving force to promote domestic self-sufficiency and was helped by the government’s protectionist policies with Gross Domestic Product (GDP) averaging 4.5%.
However in the decade 1970 – 80 the bush war and call-ups combined with sanctions provided a drag on the economy and slowed economic growth to 3.8%.[3]
Source: Wikipedia - World Banks development indicators
1980 to 1990
Independence came to Zimbabwe on 18 April 1980 and brought a resurgence in economic activity. In the following decade Zimbabwe experienced its strongest post-independence economic growth, with GDP expansion exceeding 10% in 1980 and 1981 that drew the admiration of its neighbours particularly for its living standards, basic government services including education and health and outwardly incorporated the rule of law and relative absence, in African terms, of political, economic, and social restrictions. Domestic investment averaged about 18 percent of GDP during1980-89
The economic growth for the decade averaging 4.5% was higher than the 3% average for Sub-Saharan countries.[4] However, there was considerable volatility due to large foreign capital inflows in the initial years and fluctuating weather conditions affecting the agricultural sector. In addition to the lifting of sanctions, there were big increases in government expenditure on health, education and social welfare programs.[5]
Year | Population growth rate | natural increase per 1,000 | net migration per 1,000 | Birth rate per 1,000 | Death rate per 1,000 | infant mortality per 1,000 births | Life expectancy at birth |
1990-95 | 2.34 | 25.67 | -3.25 | 36.13 | 10.46 | 50.74 | 56 |
1995-00 | 1.42 | 14.75 | -2.05 | 32.09 | 17.34 | 55.27 | 44 |
2000-05 | 0.72 | 7.26 | -0.78 | 30 | 22.74 | 61.42 | 37 |
Source: UNCTAD Handbook of Statistics 2006-7
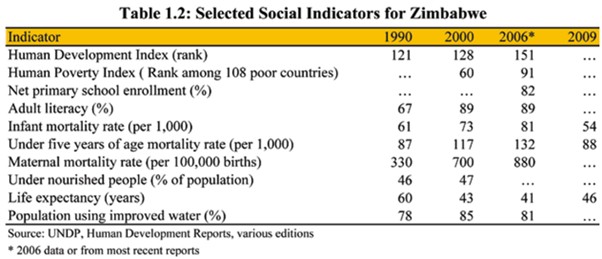
Most health indicators initially improved in 1980 - 90, but the trend became negative on most factors as the years went by. The natural increase in population fell from 25.67 to 7.26; the birth rate fell; the death rate increased (HIV and Covid clearly played a part) infant mortality increased as the health services deteriorated and life expectancy fell from 56 years to 37 years.
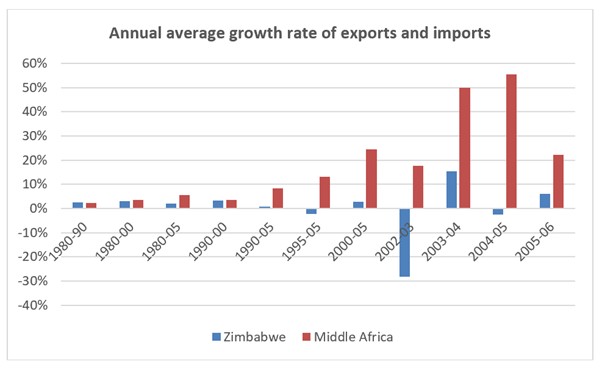
Middle Africa comprises Tanzania, Uganda, Zambia, Zimbabwe
Source: UNCTAD Handbook of Statistics 2006-7
The land inequality issue
In the 1990 – 2000 decade the simmering question of land distribution came to the fore. In the early days of Southern Rhodesia the British South Africa Company (BSAC) granted large areas of land to favoured European settlers and companies with the native population often forced off their land. See the table below, but for more detail see the articles Land and the British South Africa Company - the Renny-Tailyour and Lippert concessions and also Contemporary criticism of the British South Africa Company (BSAC) in 1889 – 90 from Henry Labouchère the editor of the journal Truth both under Harare on the website www.zimfieldguide.com
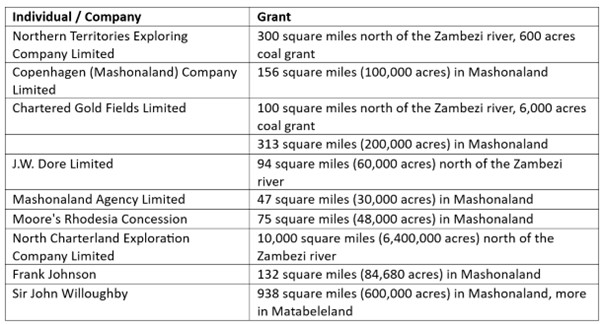
As seen from the graph below the proportion of land held by Africans had fallen dramatically by 1901 to 21%; a figure that remained relatively static to 1920. Their loss was taken up by the European individual and company proportion doubling from 8% in 1901 to 17% in 1920; the remainder apportioned under the British South Africa Company as unoccupied / unspecified land to be allocated when and how the company chose.
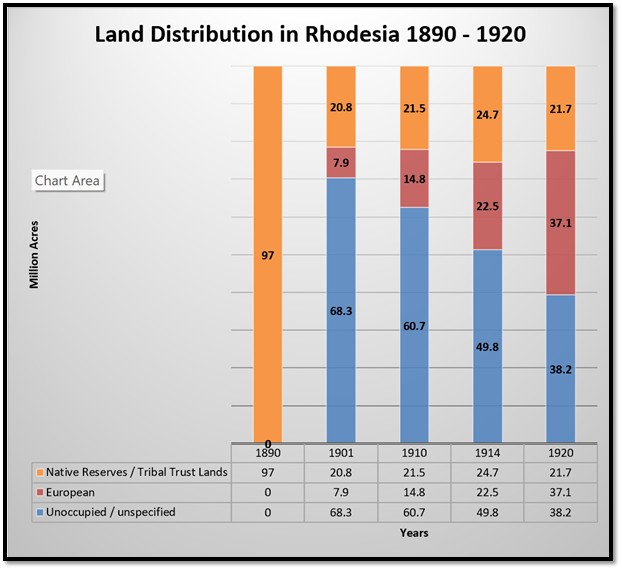
Source: C. Cross - Whoever holds the land, the natives do not in Re Southern Rhodesia
In 1922 a referendum was held when European Southern Rhodesians voted against joining the Union of South Africa. Following this, the British South Africa Company relinquished control in Southern Rhodesia on October 1, 1923, when the territory became a self-governing colony of Britain.
The first land statute was the Land Apportionment Act of 1930, which legally formalized the segregation of land based on race. Natives were allocated land considered commercially unviable by European settlers. This act allocated the best land to white settlers and restricted African ownership to designated Tribal Trust Lands and native purchase areas
As can be seen from the graph the distribution of land did not remain static over time with African land ownership increasing between 1925 to 1964 from 27% to 40%, but still disproportionately in European favour. These figures underscore the discriminatory practices that prioritized European settlement and land acquisition over the rights of the native people.
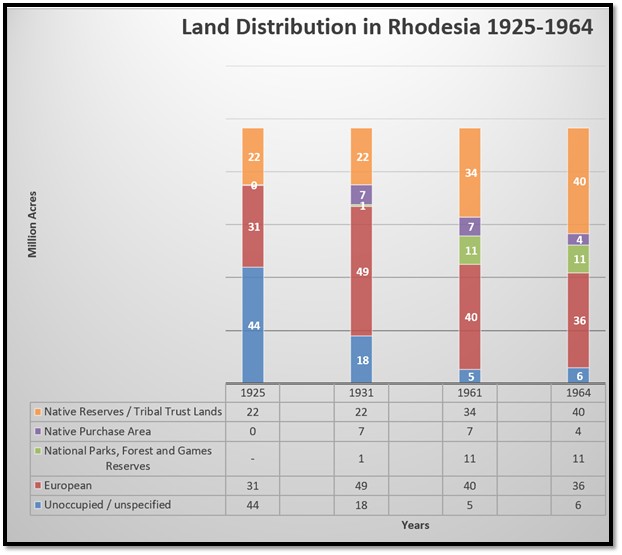
Source: Rhodesia – its Natural Resources and Economic Development / Land
At the Lancaster House Agreement in 1979, Abel Muzorewa, prime minister of Zimbabwe-Rhodesia and the Patriotic Front, led by Robert Mugabe, agreed to join negotiations with the British to decide land distribution policies for independence. They agreed all European farmers would retain their lands for at least ten years and the British UK government agreed to compensating Zimbabwe when white owners were willing to sell their farms on a “willing-seller/willing-buyer” basis.
During the 1980s, the British provided £44 million, although £3.5 million was suspended in 1989 due to ZANU-PF members receiving more than 15% of the funds.
1990 to 2000
Overall, this was a period of significant economic decline, usually attributed to the Mugabe government’s ill-fated policies and including poor governance, economic mismanagement, and loss of support of the international community and marked by hyperinflation and a severe economic crisis. The land question continued to simmer in the 1990’s but no meaningful changes took place because land under Robert Mugabe was used mainly as a means of reinforcing political support for the ZANU-PF[6] government, despite its claims that redistribution was taking place with the aim of enfranchising landless peasants.
Increasing threats of disorder from those clamouring for land backed up by the war veterans were met by increasingly authoritarian policies and police brutality leading to many deaths and widespread discontent across Zimbabwe. Basic government services continued to fall as the ZANU-PF party entrenched its hold on the civil service, living standards for the majority of the population declined, the rule of law became corrupted and democracy was weakened through rigged elections. Economic decline soon followed.
The decline of the Zimbabwe dollar in 1997 caused the cost of agricultural inputs to soar and farmers raised the price of maize accordingly. Millers increased their bread prices causing riots in December 1997 and the government reacted by introducing price controls causing some millers to go bust.
Poor government policies increased political interference in every commercial sphere, a lack of foreign exchange and an increasingly negative foreign press resulted in little or no new investment in the second half of the decade. Internal politics and the land issue raised internal tensions resulted in increasingly severe fluctuations in GDP ranging from +20% to -10%.
2000 to 2008: land redistribution program
This period was characterised by a continual decline in economic activity that was triggered by the farm invasions that not only affected agricultural activity but also rippled out and negatively impacted all the other sectors that relied upon it. Mugabe sought to re-energize the economy by redistributing white-owned land to landless black peasants and war veterans and a wave of lawlessness spread over the country causing the Zimbabwe dollar to loose half its value, plummeting from 17 to 38 to the US dollar.
The land redistribution program resulted in about 6,000 white-owned commercial farms being seized, often violently and allocated to over 168,000 black communal farmers and many ZANU-PF supporters, civil servants and armed services staff, many of whom had no interest or experience in farming. Up to two million farmhands and their dependents, making 15% of the population faced internal displacement and unemployment as a result of the farm invasions.[7] The great weakness of the land redistribution program was that the new owners did not have land titles, and as such did not have the collateral necessary to access bank loans and most had no experience with commercial-scale agriculture.
The University of Zimbabwe estimated that between 2000 and 2008 agricultural production decreased by 51% with the tobacco crop, Zimbabwe's main export crop, decreasing by 79%.[8] Wikipedia states (without a source)[9] that between 2000 – 2007 the GDP per capita contracted by 40%; agricultural output declined 51% and industrial production by 47%.
The land seizures had a very negative impact on the international community and investment completely dried up. Sanctions were imposed on those ZANU-PF individuals involved. In October 2000, the World Bank announced that it would extend no more loans to Zimbabwe due to the violence and economic disruption that accompanied land reform. Economists estimate the GDP decline was in the order of nearly 50% in real GDP growth. The adverse international press coverage from the images of war veterans harassing farmers and physical farm attacks resulting in injury and death caused capital flight and very low new investment (3%) in the country. This was insufficient to maintain existing capital with no provision for expanding investment. Expropriation of farms and the re-settlement of communal farmers caused a sharp decline in food production.
Hyperinflation
Inflation became a problem from 2000 caused initially by Robert Mugabe bowing to war veterans demands for unrealistic pensions[10] that the government could not afford as a way of buying their loyalty and political support in the upcoming elections and also by unbudgeted defence spending on the Second Congo War in 1998. In order to finance a growing budget deficit the Reserve Bank of Zimbabwe (RBZ) resorted to printing money, which led to triple figure inflation in 2006. Widespread government imposed controls on producer and retail prices that undermined their profitability, led to supply shortages of many consumer items.
In 2004 the government could not afford the interest on its foreign debt and was temporarily suspended by the International Monetary Fund (IMF) until $120 million was paid in 2005
Hyperinflation began in early 2007 and in April the parallel market was asking ZWD 30,000 for US$1. Prices were doubling daily by 2008.[11] The government printed money in increasingly larger denominations to match market prices with a one hundred trillion dollar note being issued in january 2009.[12] The unbudgeted payments to Zimbabwean war veterans in 1997 are widely considered a significant trigger for the country's hyperinflation crisis.
In April 2008, the RBZ introduced new $25 million and $50 million bearer cheques. At the time of first issue they were worth US$0.70 and US$1.40 on the parallel market, respectively.
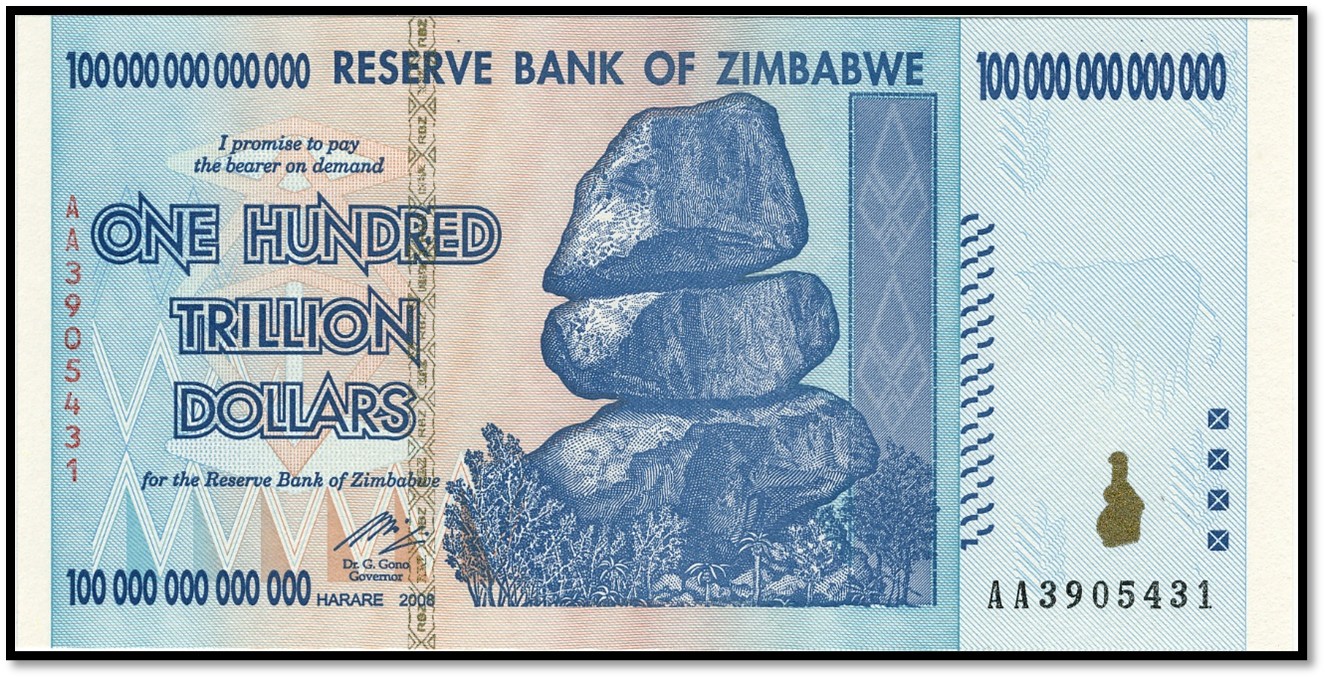
Source: Wikipedia
This resulted in a massive increase in poverty within Zimbabwe. Real per capita income fell from $644 in 1990 to $433 in 2006 and just $338 in 2008. The Zimbabwe dollar was officially abandoned in April 2009 and Zimbabwe relied on foreign currency, mostly the US$ and South African Rand.
Zimbabwe’s most important sectors - agriculture, manufacturing, mining, and services suffered major contractions partly as a result of the ZANU-PF government’s incoherent policies, but also including the fast-track land reform program, limited access to finance, infrastructure failings, price control over producer and food prices, underutilisation of the land and partly because of negative weather patterns flowing from El Niño-induced drought.
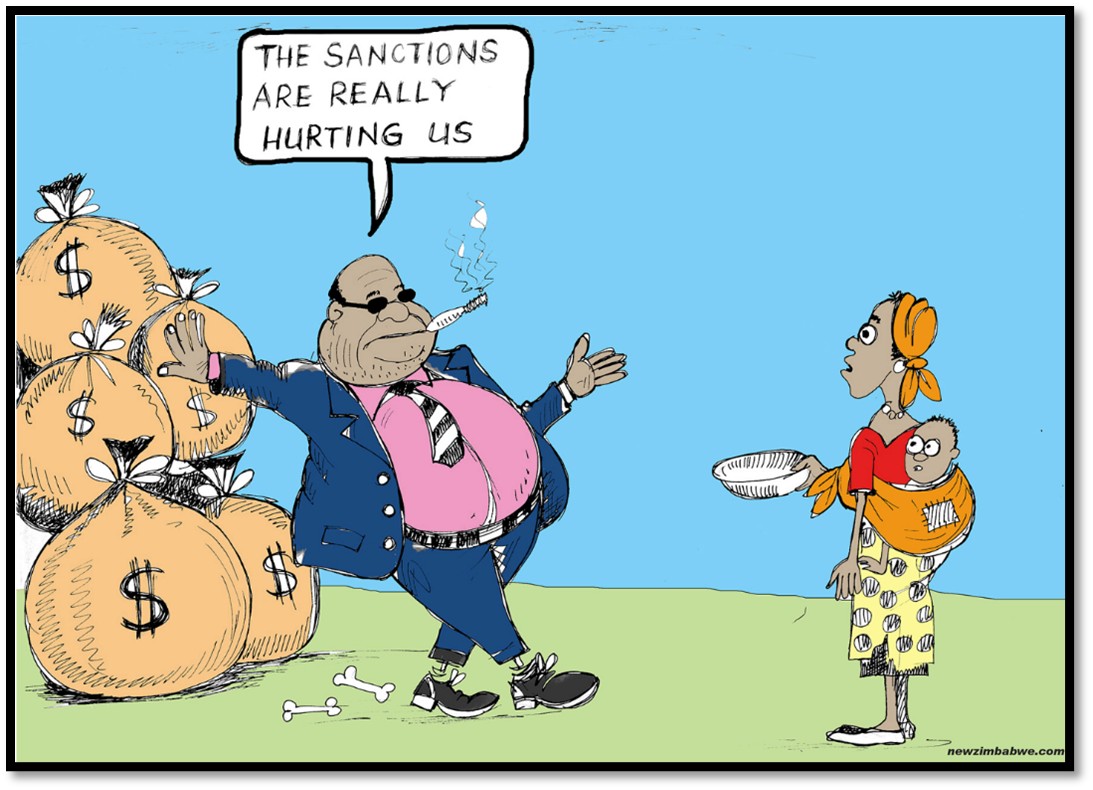
Source: New Zimbabwe online newspaper
The Mugabe government blamed these problems on sanctions imposed on Zimbabwe by western powers. In fact, these sanctions were targeted against Mugabe and his cronies and their companies.
Agriculture suffered a severe downturn particularly in the commercial and communal farming areas with its share of GDP falling from 22% in 2001 to 10% in 2008.[13] The UN World Food program (WFP) has been providing food aid to millions of Zimbabweans (+/- 4 million) since 2002, with a particular focus on rural communities where many (+/- 70%) rely on small-scale subsistence farming for their food. The decline in agriculture had a knock-on effect in the supply of inputs to the manufacturing sector as well as the industrial sector in the form of fertilizer, chemicals, stock feed, machinery and spare parts.
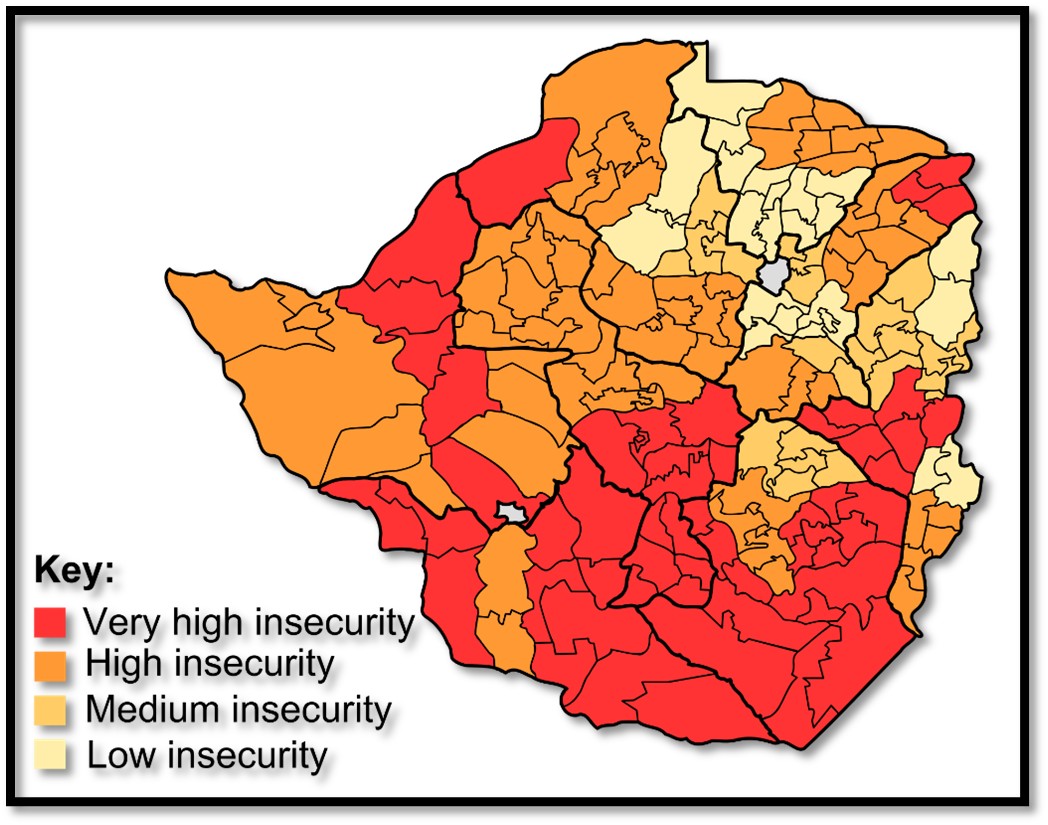
Wikipedia: Food insecurity in 2008
Mining was another sector that showed a steep decline with its share of GDP falling from 8% in 1980 to below 3% in 2008. This despite the fact that Zimbabwe has many minerals. (See the article Minerals found in Zimbabwe and verified deposits under Midlands Province on the website www.zimfieldguide.com) For example, gold production declined from 27 tons in 1999 to 3.6 tons in 2008 and missed out on the commodity boom of 2003-08. Again, the failure is due to government policies including a negative investment climate, the negative controls over revenues from RBZ, lack of foreign exchange for plant and machinery and lack of clarity over the royalty and tax regime.[14]
Diamonds from Marange and the eastern diamond fields might have solved Zimbabwe’s continuous economic crisis but was captured by the country’s elite and stolen to enrich Mugabe’s ruling circle and military and ZANU-PF officials along with their Chinese mining partners.(See the article Marange Diamonds – Zimbabwe’s natural resource stolen from the nation under Manicaland Province on the website www.zimfieldguide.com)
In addition, infrastructure limits such as power shortages, skills bottlenecks and limited access to investment have all been negative factors for the mining sector.
Between 1965-75 manufacturing grew by 11% per annum, but declined to an average of 2.7% in the 1980’s. It was negatively impacted by scarce foreign exchange and an overvalued Zimbabwe dollar. In the 1990’s government partially liberalised the economy and removed many restrictions leading to manufacturing regaining its dominant position. However the combination of hyper-inflation, shortages of foreign exchange, fuel shortages, expensive power and water, strict labour laws, price controls and skills shortages took their toll and manufacturing’s contribution to GDP declined from 23% in the 1980’s to 18% in 2000. By 2008 manufacture had experienced a cumulative decline of 92% with capacity utilization less than 10%.
The services sector made up of transport and communication, electricity, tourism and financial services contribution to GDP actually increased to 54% of GDP in 2000 to 2008 due to the severe contraction of other sectors.
Most parameters show sharp declines over the period. In 1980, Zimbabwe had the tenth highest gross national income (GNI) per capita in Sub-Saharan Africa, but by 2005 it ranked 34th out of the 48 Sub-Saharan countries.[15] Some estimates put Zimbabwe’s unemployment at 80%.
The HIV/AIDS pandemic devastated the population causing the death of many working age people; in 2006 there were an estimated 1.6 million orphans out of a population of 12 million.
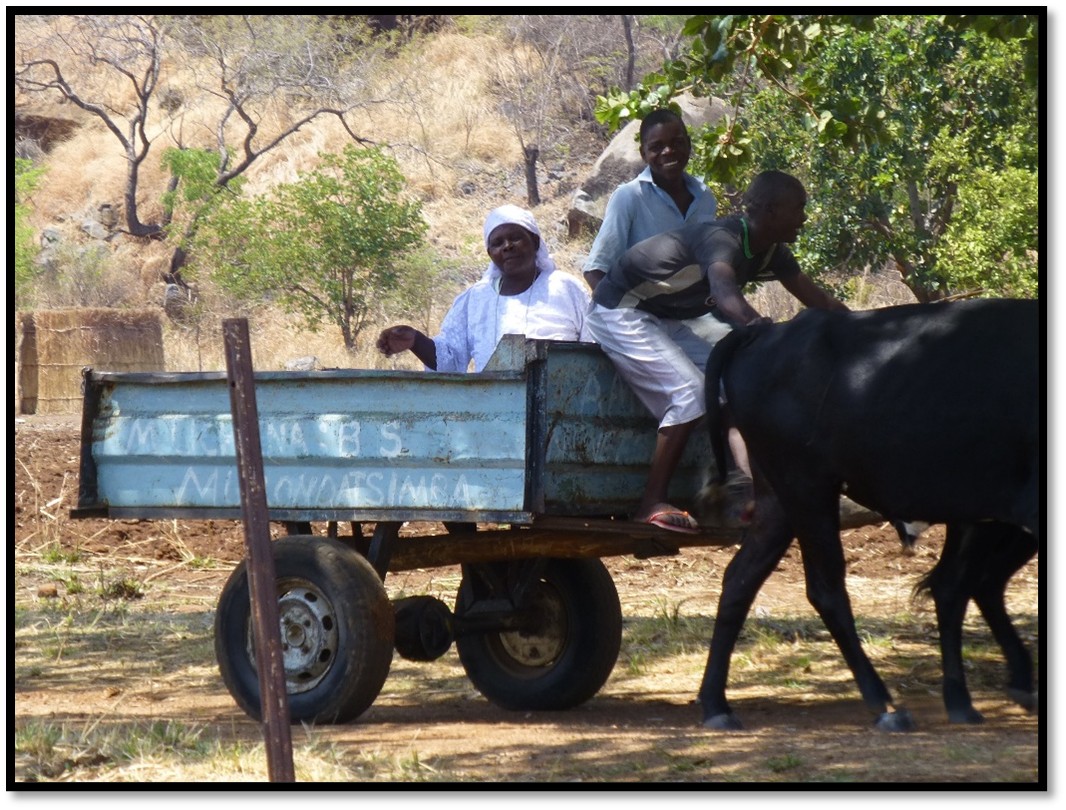
Local rural family in a Scotch cart, Mutoko area
2009-2013
In response to Zimbabwe’s negative economic crisis the three parliamentary parties agreed in 2009 to a Government of National Unity[16] (GNU) Foreign currency transactions were permitted throughout the country as a measure to stimulate the economy and end inflation and by April, Zimbabwe stopped printing its own currency. This solved the chronic problem of lack of confidence in the Zimbabwean dollar and people and businesses were free to use the foreign currency of their choice, usually the United States dollar and South African Rand.
The GNU followed a period of political crisis and contested elections and although it was ultimately to collapse through the machinations of Robert Mugabe, the President, their was a period of recovery following the formation of a coalition government, with growth rates exceeding 10% per year following the more stable and liberalised economic environment.
Agriculture was a major beneficiary growing by 14.9 percent in 2009 on a strong maize crop yield arising from a loosened grain market environment, improved support to farmers and better availability of inputs. The following year was even better for maize, tobacco, sugar and cotton.
In manufacturing capacity utilisation rose from below 10% to 30-50% in 2009 gained by removal of price controls, businesses keeping 100% of their foreign currency earnings and being able to import inputs and capital plant but were negatively impacted by erratic power and rolling blackouts and water supply shortages. Inadequate power supply from Kariba hydropower and Hwange thermal power meant up to 40% of Zimbabwe’s electricity being imported from the DRC, Mozambique, South Africa and Zambia.
Mining enjoyed a similar increase but suffered from negative investor concerns over indigenization and empowerment legislation.
Tourism enjoyed the best period for decades with the political stability and an improved international image.
The hyperinflation of 2008 came to a stop in 2009 as a result of adopting the dollar and rand, RBZ ending its money printing, the increased supply of domestic food crops and goods in the shops.
However the ZANU-PF government repaid party loyalty with jobs and the huge wage bill prevented any finance for urgent infrastructure maintenance and rehabilitation projects that were critical for economic recovery.[17] The GNU collapsed in 2013 with the elections and ZANU-PF returned to power.
The current account remained in deficit throughout the period and Zimbabwe’s external debt was highly unsustainable and continued to grow owing to interest and penalty charges on existing payment arrears. The country was in debt distress with arrears of US£1.5 billion to the international financial institutions. Currently the World Bank states that its lending program in Zimbabwe is inactive due to arrears and its role is limited to technical assistance and analytical work.
2014 to 2020
This period saw indigenisation policies implemented and regulation requiring local companies to have 51% black ownership. Again, this negatively affected investment. By this time Zimbabwe’s announced debt figure of US$7 billion[18] was 200% of the national GDP.
In 2016 the Movement for Democratic Change (MDC) estimated the annual deficit was 12% of GDP. The government said it would be laying off 8% of the nation’s 280,000 civil servants and cutting embassies and ministerial expenses in order to convince the World Bank and IMF that it had a creditable economic plan.
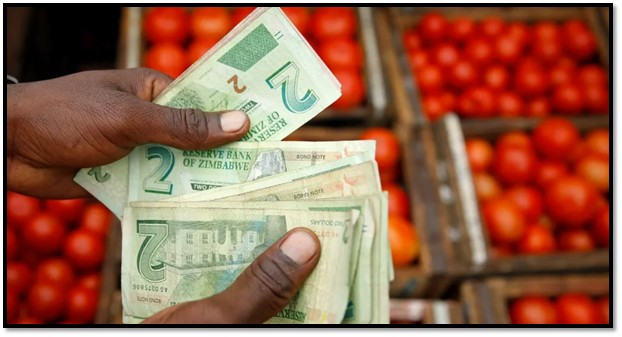
Inflation increased to over 500% in December 2019 when the government re-introduced local currency and the use of foreign currencies in local transactions was banned. The price of a loaf of bread between 2019 – 2014 went up from 2-3 Zimbabwe dollars to over 24,000 with many retailers and vendors unwilling to accept local currency.
However in 2020, blaming the challenges of dealing with COVID-19 the government permitted transactions in US Dollars once again.
Skip to 2024
Growth remains uneven, with recent setbacks due to El-Ninio caused drought in 2024 that was categorised a national disaster and significantly affected agriculture with poor harvests, lower mining prices, and industry and manufacturing was hit by short electricity supply as the poor rains resulted in the Kariba hydro-power station having insufficient water.
Public debt of US$21.2 billion in 2023 (97% of GDP) remains very high resulting in limited or no access to international finance. ZANU-PF government wage bills are unsustainably high and the money printing places pressure on the local currency, the ZiG.
Source: AllAfrica online newspaper
Departments are filled with ZANU-PF supporters, state organisations are subsidized, consequently government spending is 30% of GDP. Tax levies are high, as is the cost of regulation. Hiring and dismissing employees is slow and costly. In 2008 the unofficial estimate of unemployment was 94% and this has not changed. Many university graduates are forced to work as vendors or leave for better prospects in the diaspora.[19]
Many Zimbabweans continue to live in poverty from dependence on low productivity subsistence agriculture, or informal trading through a lack of job opportunities and poor educational realisations because parents cannot afford school fees.
Zimbabwe compared with other Southern Africa countries
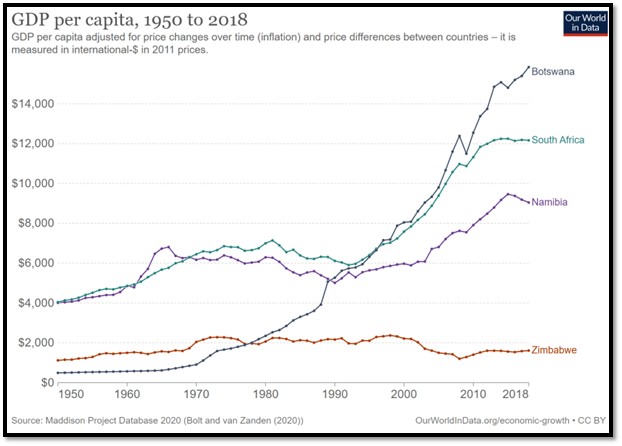
This graph says it all, doesn’t it?
A 2014 report by the Africa Progress panel found Zimbabwe had the lowest growth rate of all the African countries.[20]
An increasing national economic decline
Overall, Zimbabwe's economic growth has been characterized by volatility and a range of factors influencing its performance, including global commodity prices, climate conditions, and poor ZANU-PF government policies and corruption.
References
African development Bank Group. Zimbabwe Report – From Stagnation to Economic Recovery efaidnbmnnnibpcajpcglclefindmkaj/https://www.afdb.org/fileadmin/uploads/afdb/Documents/Generic-Documents/...
M.O. Collins. 1 Jan 1965. Rhodesia Its Natural Resources and Economic Development
Ciaran Cross. 26 July 2018. Whoever owns the land, the natives do not: In Re Southern Rhodesia. https://criticallegalthinking.com/2018/07/26/whoever-owns-the-land-the-natives-do-not-in-re-southern-rhodesia/
UNCTAD Handbook of Statistics 2006-7. https://unctad.org/publication/unctad-handbook-statistics-2006-07
Wikipedia: Zimbabwe
Wikipedia: Economy of Zimbabwe
World Banks development indicators. http://databank.worldbank.org/ddp/home.do?Step=12&id=4&CNO=2
World Bank Group. The World Bank in Zimbabwe. https://www.worldbank.org/en/country/zimbabwe/overview#:~:text=Economic%20context,growth%20and%20disrupted%20winter%20irrigation.
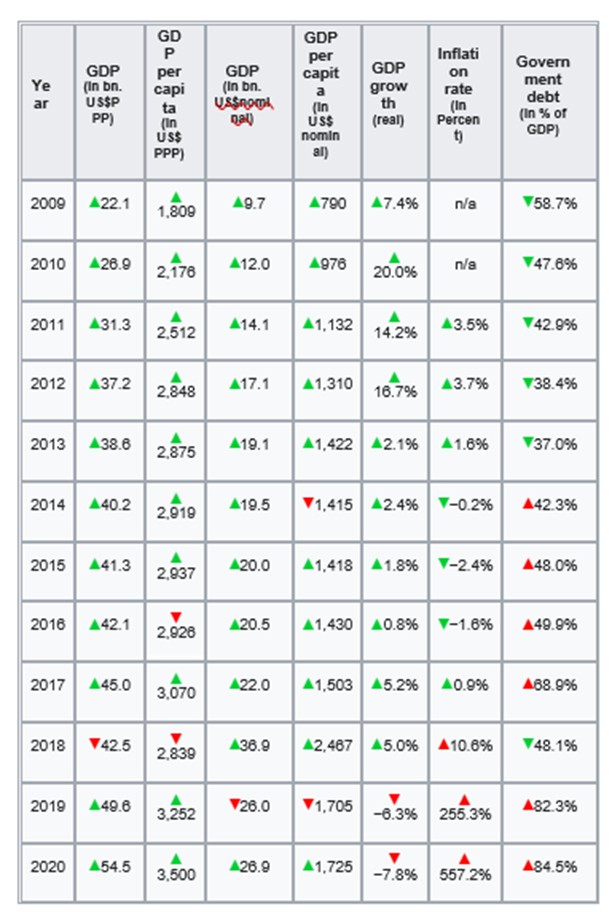
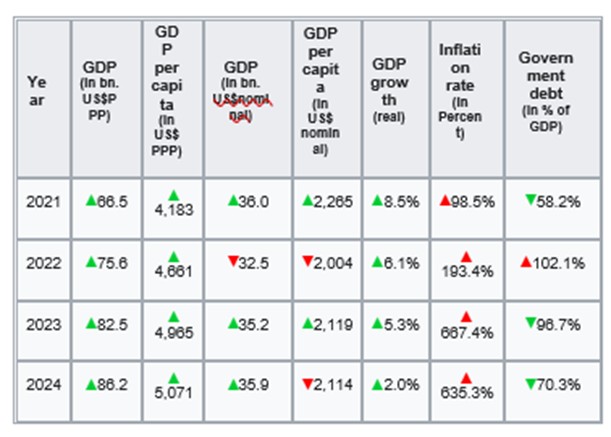
Appendix – main economic indicators Zimbabwe 2009 – 2024: Source: IMF "Report for Selected Countries and Subjects"
Notes
[1] https://www.wfp.org/countries/zimbabwe#:~:text=Zimbabwe,%20a%20landlocked,%20low-,season%20from%20January%20to%20March.
[2] African Development Bank Group: Zimbabwe Report - From Stagnation to Economic Recovery
[3] Ibid
[4] African Development Bank Group: Zimbabwe Report - From Stagnation to Economic Recovery
[5] School enrolment increased by 232 percent one year after primary education was made free, and secondary school enrolment increased by 33 percent in two years.
[6] ZANU-PF: Zimbabwe African National Union – Popular Front
[7] Margaret Wurth and Jane Buchanan. A Bitter Harvest: Child Labor and Human Rights Abuses on Tobacco Farms in Zimbabwe. Human Rights Watch, 2018.
[8] Godfrey Marawanyika. 4 November 2013. "Mugabe Makes Zimbabwe's Tobacco Farmers Land Grab Winners"
[9] Wikipedia: Zimbabwe - History
[10] War veterans were paid a ‘one-off of $50,000 in December 1997 (3% of national GDP) and a monthly pension of $2,000 beginning January 2008
[11] The Zimbabwe dollar was devalued by the RBZ twice; first to 9,000 to the US$, and then to 17,500 to the US$ in 2005
[12] Wikipedia: Zimbabwean one hundred trillion dollar note
[13] African Development Bank Group: Zimbabwe Report - From Stagnation to Economic Recovery
[14] Ibid
[15] Ibid
[16] The GNU was a power-sharing agreement between ZANU-PF and the two factions of the MDC (Movement for Democratic Change) meant to address the political and economic crises facing Zimbabwe, including the hyperinflation and political violence.
[17] Ibid
[18] Some economists say this figure was much higher at $11 billion once debts to other African countries and China were included
[19] Joint Needs Assessment for Zimbabwe: Identifying Challenges and Needs, African Development Bank report, 2019 https://www.afdb.org/sites/default/files/2020/01/14/zimbabwe_country_portal.pdf
[20] Africa Progress panel. 2014 "Fish, Grain and Money: Financing Africa's Green and Blue Revolutions"