World Wildlife Crime Report – Elephant Ivory
Introduction
This article almost entirely relies on the United Nations Office of Drugs and Crime (UNODC) report called the World Wildlife Crime Report 2020: Trafficking in Protected Species hereafter called “the report.” I have extracted most of the information relating to elephant ivory from that report which is available as a pdf from their website. Most of the report and conclusions have been copied verbatim.
The report draws its information from the seizure data in UNODC’s World WISE
Database which now contains just under 180,000 seizures from 149 countries and territories. This is supplemented by the new CITES illegal trade reporting requirement. CITES Parties are required to submit data on all seizures of wildlife made in the previous year and information from 2016, 2017 and some countries for 2018 is included in the database.
Information on global wildlife crime and trafficking can be found in the article World Wildlife Crime Report – Overview which is found under Masvingo on the website www.zimfieldguide.com
In the 2016 World Wildlife Crime Report, elephant ivory and rhino horns were discussed separately. Elephant ivory was discussed under the heading of “art, décor, and jewellery” and as an investment commodity. Rhino horn was classified as a traditional medicine, although it was already apparent at that time that it had also become a status item. In the last four years, the evidence has mounted that rhino horn is also being sold for its artistic and investment value, so it is similar to ivory in this respect. The two commodities are sourced from different regions in Africa but require similar skills and equipment to procure. They also share many commonalities in their primary destination markets.
The poaching of both elephants and rhinos appears to be in decline, as do the markets generally. For elephant ivory, a downward trend since 2011 can be seen in the best available indicators of poaching, smuggling, and price. A similar, but more recent, trend can be seen with rhino horn poaching and prices, although seizures of rhino horns have continuously risen. A 2019 surge in very large seizures of both commodities may be related to the unloading of stocks in response to declining prices.
How the value of seizures of elephant ivory has doubled in value
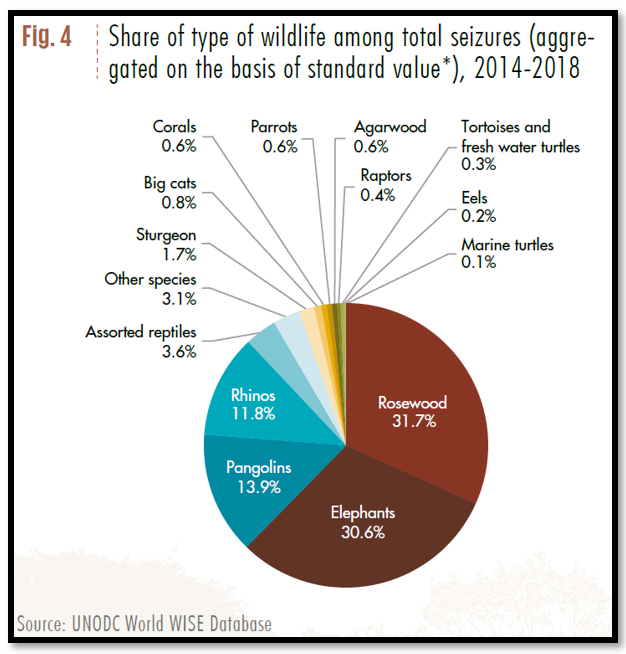
The 2009-13 period figures showed that, on the basis of the value of seized shipments, elephant ivory accounted for 33.1% of the total value: ahead of rhino horn (5.5%) assorted reptiles (4.3%) and pangolin (4%) but a long way behind rosewood timber (40.7%)
But for the period 2014 – 2018 the above chart shows the value of seizures of elephant ivory has decreased to 30.6% as has rosewood (31.7%) but pangolins has trebled to 13.9% and rhino horn doubled to 11.8%
Elephant Ivory seizures have decreased
Perhaps the most revolutionary policy change in the past four years occurred in the trafficking of ivory, as several of the largest legal domestic markets were sharply restricted. Around the same time, several indicators suggested the illicit market went into sharp decline. The relationship between these two trends requires further investigation, but it is possible that the loss of the legal market undermined investor confidence, flooding the market with more ivory than required by retail demand.
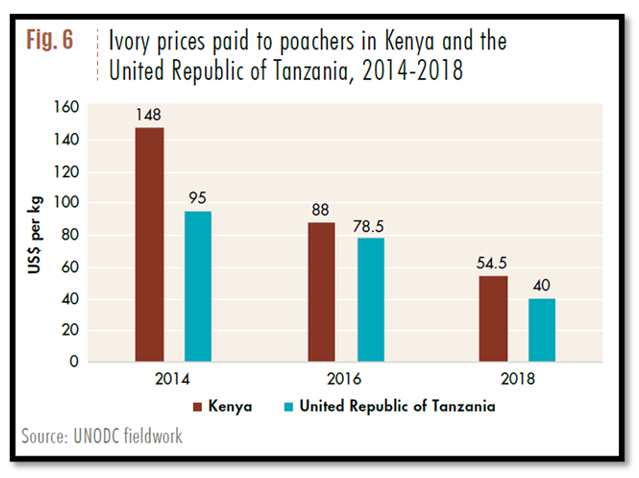
Data on poaching and trafficking indicate that the ivory supply saw a resurgence around 2007 and grew steadily until around 2011, declining until 2016, and stabilizing at much lower levels in the following two years. Prices in both East Africa and Asia appeared to have risen from 2007, peaked around 2014, and to have declined dramatically in the following years. Similarly, rhino horn poaching appears to have risen from 2007, peaked in 2015, and declined every year since that time, with prices also declining during this period. (Fig. 6)
Overview to the elephant ivory market and current trends
Some very large seizures of both ivory and rhino horn were made in 2019, which is likely to be a record year once all the data are in. Unless indicators emerge of renewed poaching, the
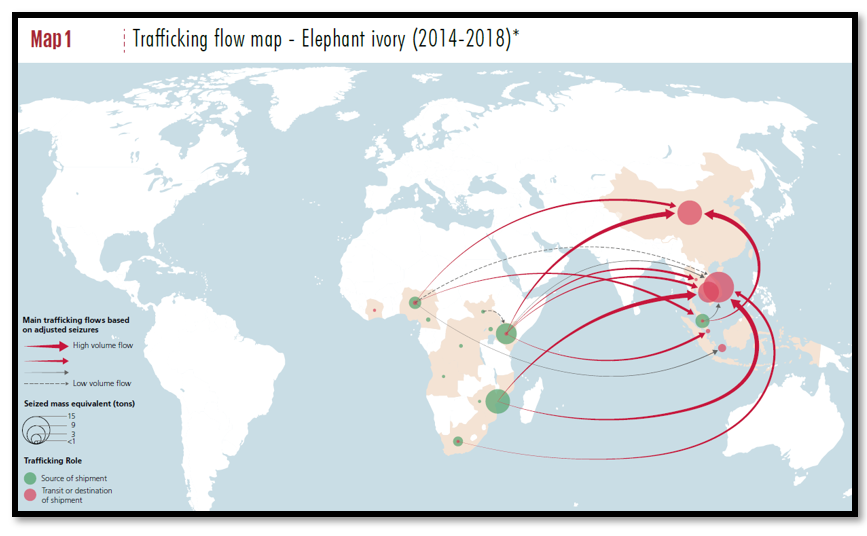
source of this ivory was likely stockpiles, exported before prices decline further still. Seizure data also show a dramatic reorientation in the routing of ivory. While East Africa (particularly Mombasa, Kenya) was the primary source of illicit shipments in the past, Nigeria has become a dominant collection and transit point over the last four years. Similarly, while China dominated in the past, Vietnam has emerged as the primary destination of these shipments. In addition, large mixed shipments of ivory and pangolin scales have risen in prominence, suggesting experienced ivory traffickers are using their expertise to move a rising illicit commodity.
The annual illicit income generated from ivory and rhino horn trafficking between 2016 and 2018 was estimated at US$400 million for ivory and US$230 million for rhino horn trafficking. The largest shares of income are generated at the retail level, where rhino horn and ivory are processed and sold to end consumers. The emerging illicit financial flows (volume of cross-border transactions) could be – depending on how complex the supply chains are – almost twice as much, namely US$ 570 million for ivory and US$390 million for rhino horn. There is, however, a large range of possible scenarios.
Routes used for trafficking elephant ivory from Africa to Asia
The Great Elephant census showed the elephant population declined by 20%
In addition to the regular scientific efforts, a concentrated study was conducted on savannah elephant populations using aerial surveys in 18 range states in 2015, dubbed “the Great Elephant Census.” The results of these surveys were integrated into the IUCN African Elephant Status Report 2016. The AESR 2016 reports a strong decline in elephant populations based on estimates made in 2006 and 2015 (Figures 1 and 2)
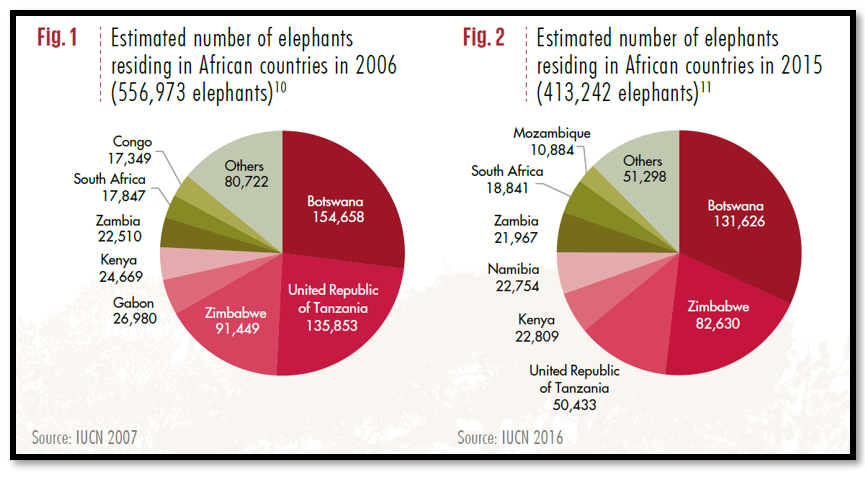
The AESR 2016 estimated that there were just over 400,000 elephants in the areas surveyed and over 100,000 in the areas not systematically surveyed which combined cover 62% of the known and possible elephant range. The AESR compared their 2015 figures to similar estimates made for 2006 and found that there had been a net decline in elephant populations of about 111,000 elephants in the areas comparably surveyed in the intervening years. This decline suggests that unexplained losses not only offset expected natural population growth (which would have left the population unchanged) but also reduced the elephant population by an average of about 10,000 elephants per year.
While not all the missing elephants were poached, available data show that poaching over the last decade undoubtedly accounts for a significant portion of the elephants killed, potentially resulting in some one thousand metric tons of illegal ivory over the decade, or an average of about 100 tons per year.
Over half of this continental decline can be attributed to losses in Tanzania, where the estimated population declined from 135,853 in 2006 to 50,433 in 2015. The elephant populations in the Selous and Ruaha reserves in Tanzania alone declined by nearly 75,000 elephants between 2006 and 2013. Since 2015, Tanzania has increased its efforts against poaching and trafficking, supported by NGOs.
Other areas where the IUCN noted negative population trends associated with poaching included Gabon, Congo and Cameroon, as well as northern Mozambique (the Niassa range along the border with the United Republic of Tanzania and the Selous reserve) and parts of Kenya. Serious long-term declines were also noted in the populations of Central Africa as well as parts of Southern Africa (parts of Zimbabwe, Angola, and, to a lesser extent, Zambia), which were attributed in part to poaching
These national population trends resonate with the findings of DNA research conducted on 28 major ivory seizures between 2010 and 2016. The majority of the seizures were traced back to two broad elephant populations: one extending from central Tanzania to northern Mozambique (including Selous and Ruaha) and one centred on the TRIDOM area (north-east Gabon, north-west Congo, and south-east Cameroon). They also align with the trafficking data, discussed below, which indicate East African (Mombasa) and West African (Lagos) hubs for illicit trade.
Zimbabwe loses nearly 10% of its elephant population
Zimbabwe’s estimated elephant population went from 91,449 in 2006 to 82,630 in 2015, a decrease of 9.6%. Whilst not as serious as the declines in Tanzania and Botswana, it does reflect a worrying situation.
How many elephants are being poached?
Another way of estimating the number of elephants poached (and thus the illegal ivory supply) is to extrapolate from elephant carcass data. Trends in elephant poaching are monitored by the CITES program “Monitoring the Illegal Killing of Elephants” (MIKE)
Based on a network of over sixty sentinel sites, participating rangers report the number of dead elephants they detect and the share of these dead elephants that appear to have been illegally killed. According to CITES, the designated MIKE sites in Africa hold an estimated 30 – 40% of the African elephant population. The “share of the detected elephant carcasses that have been illegally killed” is known as the Proportion of Illegally Killed Elephants (PIKE), and it is calculated at the subregional and continental levels, adjusted for sample variation.
Since 2002, over 22,000 elephant carcasses have been so categorized, with between 1,000 and 2,000 observations per year between 2007 and 2018. Detections of both elephant carcasses and illegally killed elephants peaked in 2012, but the PIKE score was highest in 2011. Since then, it has declined every year until 2018, during which it increased by about 0.6%.
This approach has been applied in the past to generate poaching estimates between 2010 and 2012 and was extended to 2018 using updated population and PIKE data (Fig. 4) These estimates suggest some 157,000 elephants were poached between 2010 and 2018, or an average of about 17,000 elephants per year. They show a declining trend in poaching since 2011, rising again slightly in 2017 and 2018 (Fig. 4)
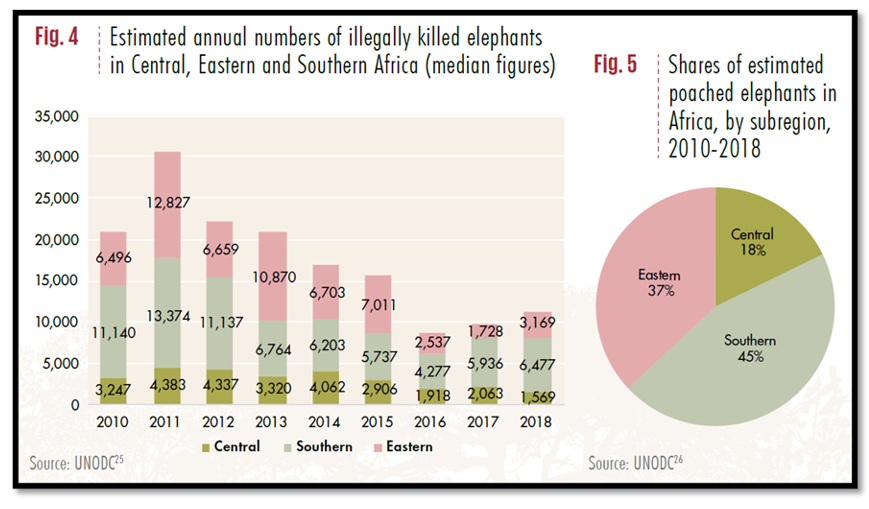
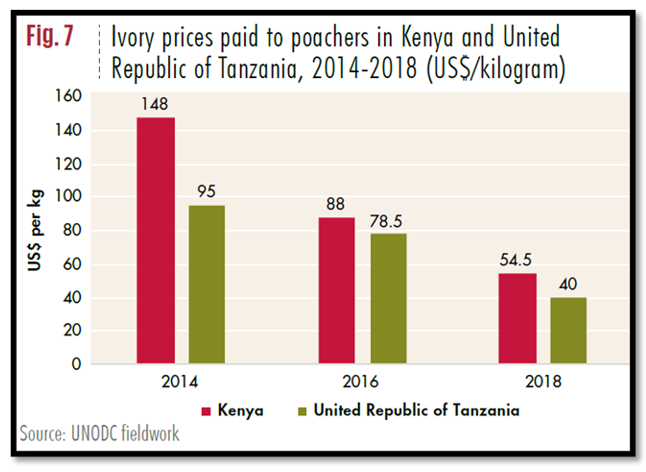
Looking at both population-based and poaching data-based estimates, it appears that between 10,000 (population loss average) and 17,000 (poaching estimate average) elephants were poached per year between 2006 and 2018, producing potentially between 100 tons and 170 tons of illicit ivory on average per year. Based on both population modelling and the PIKE estimate, it appears that the illegal ivory supply has been declining since 2011. If demand is constant or growing, then a decline in supply would normally result in a rise in prices. But despite indications that the supply of ivory is declining, the price of ivory in Africa also appears to have declined since 2014. UNODC fieldwork conducted in 2018 in
Kenya and Tanzania found that poachers were being paid between half and one-third of the price they were paid in 2014 (Fig. 7) Reports from the field even suggested that some poachers were holding onto their tusks in hopes that the price would eventually rise.
Trafficking
Trafficking patterns can be detected through seizure records, but these do not give an accurate representation of the volume of the trafficking because it is not clear what share of the contraband flow is being seized, and this share can vary from year to year. This is particularly true with ivory seizures, where the total volume seized regularly doubles or halves year-on-year (Fig. 8) Nonetheless, long term trends can be triangulated with other trend data to give an indication of market dynamics.
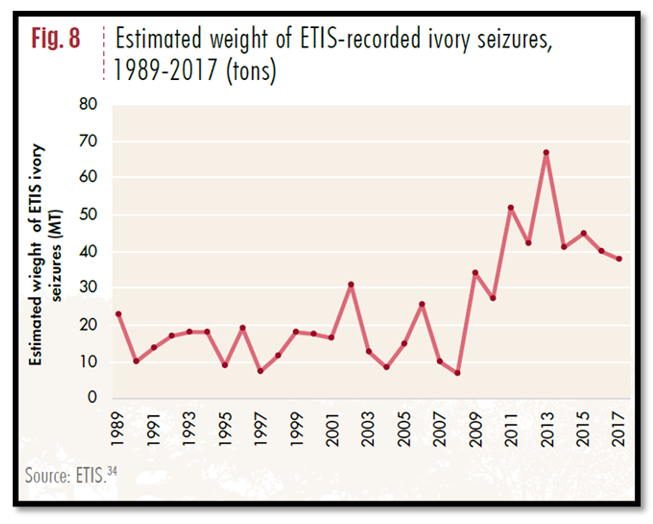
The official CITES data on elephant ivory seizures are maintained by TRAFFIC in the Elephant Trade Information System (ETIS). These raw data show the total annual weight of seizures reported to ETIS began to decline in 2013 and the number of seizures declined after 2011.
The trend parallels the decline seen in the poaching data: both indicate that ivory trafficking grew between 2007 and around 2011-2013 and has experienced an overall decline since that time.
If, as suggested above, an average about 100 tons to 170 tons of illicit ivory per year were generated between 2010 and 2018, the ETIS seizure figures suggest a high rate of interdiction: 17-35% on average across the decade.
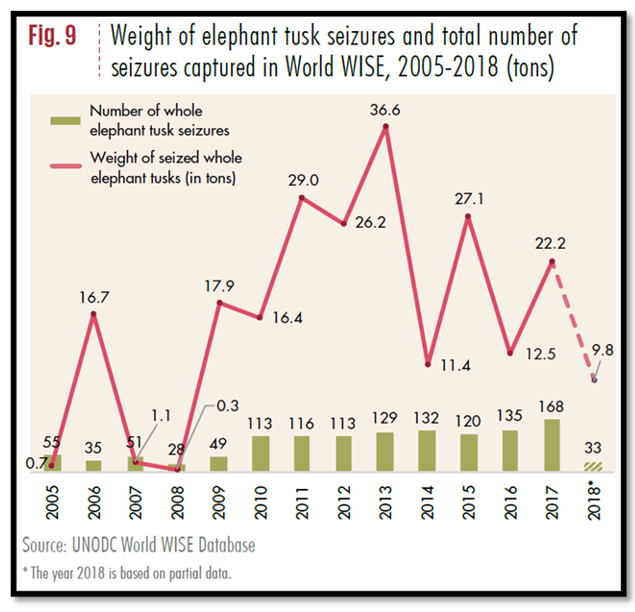
Looking just at tusks, the trend between 2007 and 2017 is similar to the ETIS raw data (Fig. 9) with sharp growth between 2009 and 2013 and an uneven decline since then.
Based on World WISE records of some 1,262 African elephant tusk seizures where an alleged destination was known, between 2005-2017, China and South-East Asia were the destination of 90% of these shipments by weight (Fig. 10) However, some of the countries listed as destinations in World WISE for illicit ivory shipments are highly likely to be transit countries.
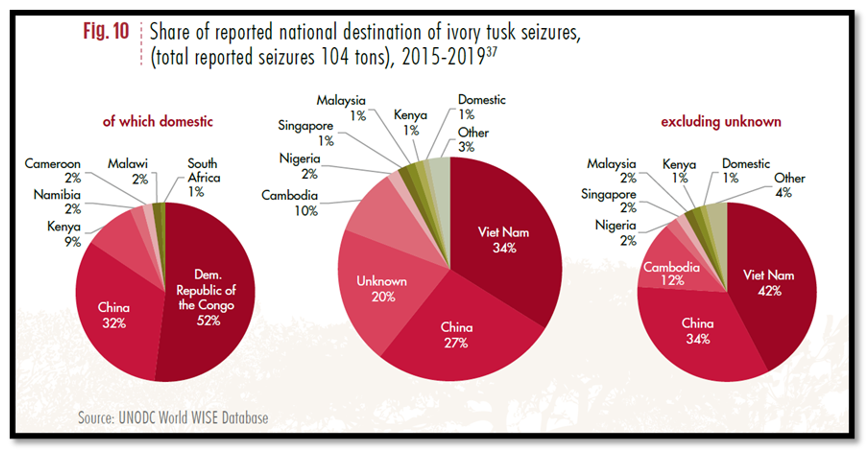
While destination markets for raw ivory do exist outside South-East Asia and China, it appears that almost all the illicit tusks detected are bound for this region. Analysis using the latest data shows a different picture in the identified destination of illegal ivory shipments to that in the previous World Wildlife Crime Report, with a growing role for countries like Vietnam and Cambodia. For example, using data up to 2015, Vietnam was the destination of about 3% of total weight of ivory interdicted but using recent data (2015-2019) the share has increased to 34%. Recently, almost all the major seizures recorded in World WISE were destined for Vietnam and Cambodia, although data in World WISE for 2018 and 2019 do not have the same coverage as previous years.
Just five large scale seizures made in 2019, totalling over 30 tons, would make it a record year for seizures, contradicting the downward seizure trend seen since 2014. Since poaching levels appear to be down, this suggests either improved interception (a higher share of the ivory flow being captured) or sourcing from stockpiles (not from recent illegal killings)
Criminal gangs do most of the trafficking
Forensic research suggests that a limited number of criminal groups may be responsible for a large share of the ivory seized (and, possibly, trafficked). This conclusion was reached by linking ivory shipments to a common trafficking organization when DNA from the same elephant was found in two seizures. A large share of the seizures tested could be thus linked together, suggesting as few as three or four major criminal groups were involved in the bulk of the trafficking.
Another trafficking trend of note is the growth of mixed seizures containing both ivory and pangolin scales, often in large volumes. For example, on 21 July 2019, the government of Singapore seized almost 12 tons of pangolin scales alongside almost nine metric tons of ivory – remarkably large quantities of both commodities – in a container coming from the Democratic Republic of the Congo on its way to Vietnam, declared as timber. Wildlife seizures containing products of multiple species are fairly rare in World WISE, so this recent trend is worthy of attention. It is possible that ivory traffickers, facing declining demand, are taking advantage of their established networks to move a commodity for which demand is growing: pangolin scales. The 2019 West and Central Africa Wildlife Crime Threat Assessment noted that interviewed poachers knew that hunting pangolins was illegal, but they felt this offence was taken less seriously than elephant poaching.
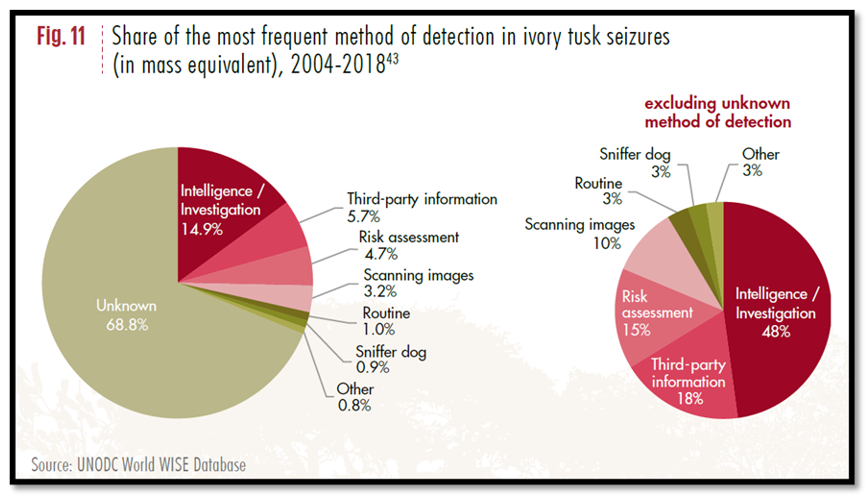
Based on an analysis of 265 cases of ivory tusk seizures (accounting for 72 tons of ivory), made in 41 countries (where the reason for the seizure was reported), it appears that the vast majority were made due to investigations, risk-assessments, and tip-offs, with only 3 per cent being found during routine inspections (Fig 11) This highlights the importance of intelligence-driven approaches and risk management practices in ivory interdiction.
Countries that seize a lot of ivory do so because they have invested in finding it. Based on records involving the seizure of 144 tons of ivory tusks, China (specifically the Kwai Chung area of Hong Kong) and Vietnam (specifically Haiphong) lead the world in ivory seizures, followed by Port Klang in Malaysia and Mombasa in Kenya.
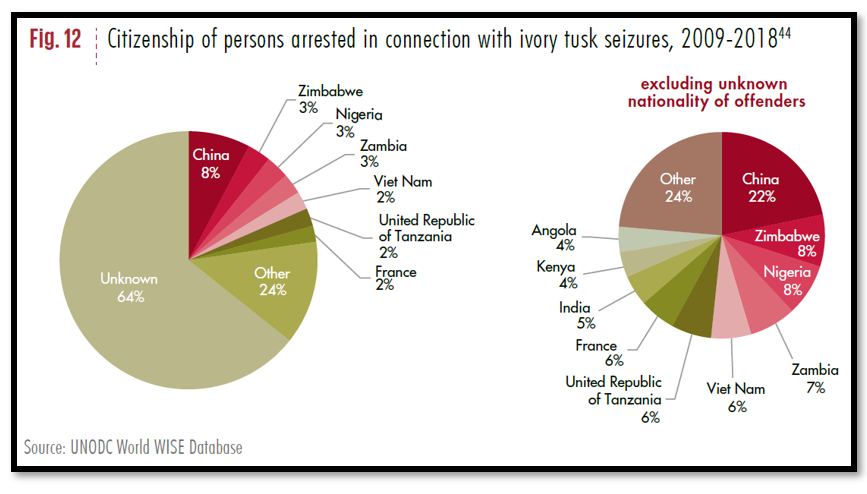
Based on those cases where the exact location of the seizure was specified, most of the tusks were seized at seaports, although private houses and airports were also frequent sites of tusk seizures. The majority of the tusks were found hidden in freight, although not all were concealed. Most seizures involving shipping containers do not present immediate opportunities for arrests but, based on 221 cases where arrests were reported in connection with the seizures, Chinese nationals were most frequently arrested, followed by Zimbabwean, Nigerian, Zambian, and Vietnamese nationals (Fig. 12)
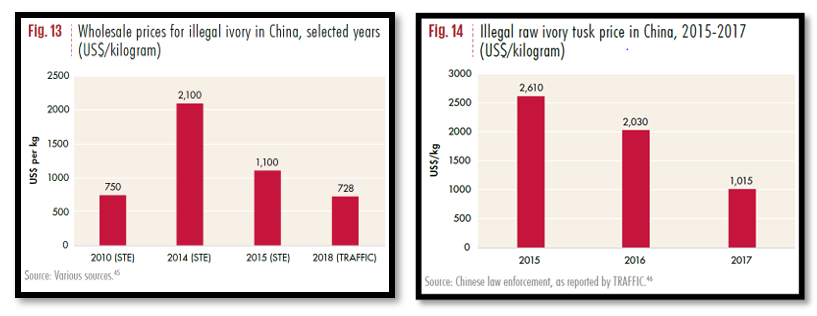
Numerous reports on Asian markets have indicated a decline in the price of illicit raw ivory tusks after 2014. This trend parallels the decline in price paid in Africa. Based on observational studies, prices in China almost tripled between 2010 and 2014, only to drop below their 2010 levels by 2018 (Fig. 13) This declining trend was also reflected in price data gathered by the Chinese police in 50 law enforcement operations between
2015 and 2017 (Fig. 14) These trends in China were paralleled by a decline seen by the Wildlife Justice Commission in 22 undercover price quotations in Vietnam. The 2018 price observed in China (by TRAFFIC) and Vietnam (by WJC) are very similar, and both are similar to the price in 2010.

Another indicator of the decline of the ivory market comes from studies on the type of objects being offered for sale in markets in South-East Asia and China. Surveys conducted around 2014 in China noted the sudden presence of whole polished tusks in urban markets. The last World Wildlife Crime Report suggested that these were marketed to speculators more interested in the raw material than the art or jewellery that could be made from it. Large carved art-pieces were also prominent in the Chinese market at this time.
However, a 2017 survey of 22 cities in China found that 90% of the illegal ivory objects offered for sale were small items, primarily jewellery. This suggests that interest in buying raw ivory or large artworks for their investment value has declined, leaving only the retail market for trinkets. Of course, large investors in raw ivory were unlikely to buy from visible retail establishments even during peak demand, but the decline in visible high-value items is a significant indicator of the health of the market. It is also possible that sales have moved online, but physical markets remain important in this market. Recent surveys in China suggest only a small share of ivory buyers (17% in 2018) bought ivory online, with most buying it in person either in China or while overseas.
The situation in South-East Asia appears to be similar. Today, the ivory markets in Vietnam and Thailand seem largely limited to bangles, amulets, and other jewellery. A 2018 survey of 60 online sellers and 852 physical outlets in 13 locations in Vietnam found that 90% of over 10,000 items reviewed were jewellery, and only the top 1% were priced over US$200.
In Japan, which retains a legal domestic ivory market, 80% of ivory is used to produce hanko name seals, though ivory is also worked into jewellery and other finished products often targeted at an international tourist clientele. A survey of Japan’s physical ivory market and auctions in 2018 found a strong reduction in the number of whole tusks offered for sale.
Trend analysis
The downward trend in supply and price is likely due to some combination of several factors. As discussed above, an average of around 100 to 200 tons of ivory had been entering the market annually since 2007. Ivory is a durable good, so unless the market continued to expand, at some point supply would exceed demand. The exact point when this occurred is unclear, but was likely sometime between 2011 and 2015, and prices fell as the market adjusted. The timing of this over-supply could have been influenced by a number of factors, including declining demand.
Changes in legislation that ban ivory products
One factor that surely affected demand was a radical change in the legal regime in some of the key legal ivory markets. In December 2015, two of the largest ivory consumer markets globally – China and the United States of America – publicly committed to closing their legal domestic markets for ivory in the future. Since the publication of the last World Wildlife
Crime Report, this promise has been enacted in law in both countries. On 6 June 2016, the relevant rules under the United States Endangered Species Act were revised, prohibiting import, export, and interstate trade of African elephant ivory, with very limited exceptions. On 30 December 2016, the Chinese government announced its decision to end the commercial processing and sale of ivory by the end of 2017. In 2018, the Hong Kong Special Administrative Region of China also announced the implementation of a three-step plan to phase out the trade in elephant ivory by the end of 2021, and to impose heavier penalties to enhance deterrence of the illicit trade in endangered species.
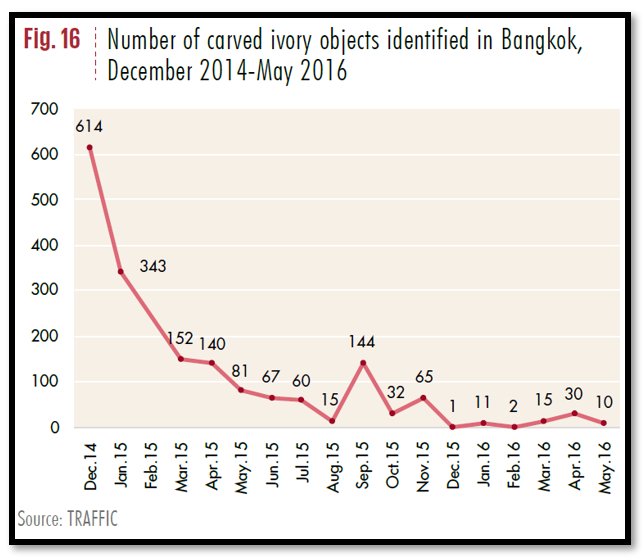
In addition, Thailand has taken significant measures to criminalize the trade of African elephant ivory. Thailand initiated a series of reforms at the beginning of 2015, including the listing of African elephants on the national protected species list, mandatory countrywide registration of privately-owned ivory objects and several other measures. In response, some 40,000 people registered over 200 tons of ivory with the national
authorities, underscoring the importance of Thailand as an important ivory market. Significant reduction in ivory for sale in the domestic market was observed in 2016. While not a ban on domestic sales, these measures appear to have dramatically reduced the visible retailing of ivory in Bangkok.
These restrictions in the legal market may have had an impact on the illegal one. Targeted surveys conducted in 2017 and 2018 in China found that many consumers have lost interest in ivory. Even among those open to the purchase of ivory, the share that had purchased in the previous year declined. Some respondents said they saw owning ivory as shameful after the ban. In other words, the closing of the legal ivory market changed the way people view ivory as a product. Despite this shift, the survey found a contingent of die-hard ivory buyers, primarily affluent men who travelled abroad frequently and purchased the ivory while overseas. In this way, tightened controls in China likely had the unintended consequence of displacing ivory markets into neighbouring countries.
It may be that speculation, not retail demand, was driving the poaching since 2007, as suggested by the previous World Wildlife Crime Report. Of course, by its nature, speculation is not directly tied to retail demand. The price of gold, for example, is not determined by trends in the retail jewellery market. But ivory’s value as an investment may have declined relative to competing investment vehicles due to the tighter controls. Once large investors began to sell, the cascading flood of ivory could have pushed the price for poached ivory down. One problem with the idea that tightened legal market controls undermined demand is the timing of the decline. These policy innovations only started in 2015. The data presented above suggest that poaching has been declining since 2011 and price has been declining since 2014. It may be that while poaching peaked in 2011, ivory trafficking only peaked in 2013 as suggested by seizure data or in 2015, as suggested by modelled ETIS data.
It is also possible that, as researchers have suggested, prices began to drop in anticipation of the legal market ban. If the speculators knew in advance that market restrictions were forthcoming, they could have started dumping their ivory stocks in response. Buyers for this surplus could have been those who were directly involved in producing ivory artefacts: the carving factories. These buyers know what retail ivory objects can be sold for, so the price they were willing to pay would be much lower than the speculative price paid in 2014. Thus, the illicit market wholesale price as reported by market observers in 2018 is about the same as that observed before the boom in 2010: about US$750 per kilogram.
Based on just the five major seizures cited above, it appears the global seizure trend will reverse in 2019. Poaching data for 2019 is not yet available but would have to reverse starkly to match the seizure trend. Unless evidence of renewed poaching emerges, this suggests either an increase in interdiction rate, or the use of stocks, rather than freshly poached elephants.
References
World Wildlife Crime Report Trafficking in protected species 2020. May 2020. United Nations Office on Drugs and Crime, Vienna